Templates
Diagram templates
Start a diagram from a layout that is already connected: flowcharts and swimlane processes, org charts, sitemaps and Venn diagrams, made of ordinary shapes and connectors you can rearrange.
23 free templates · Editable · Works with Claude and ChatGPT
All 23 diagram templates
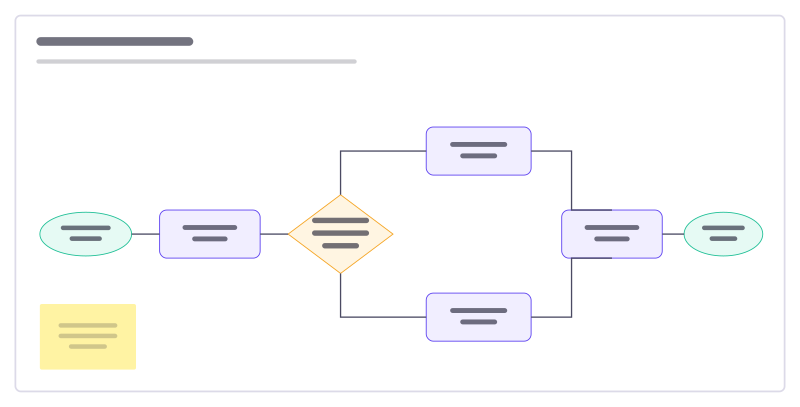
Flowchart starter
A support-request flow with a decision, two branches and connected steps.
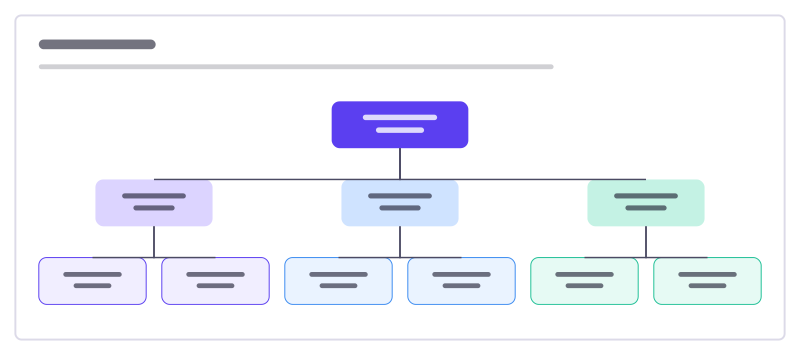
Org chart
Who leads what: a three-level reporting tree with connected, editable boxes.
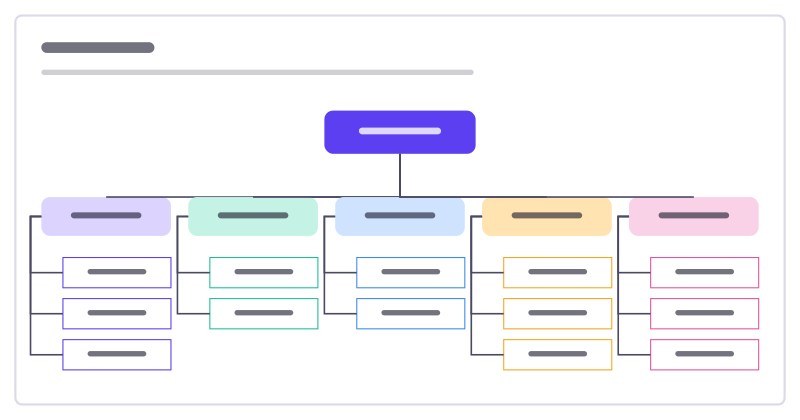
Sitemap
The pages of a website or app as a tree: home, main sections and the pages inside them.
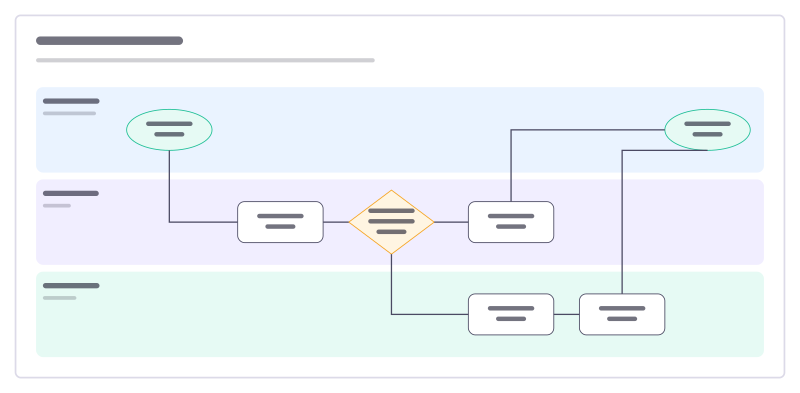
Swimlane process
A process across three teams: who does each step, and where work changes hands.
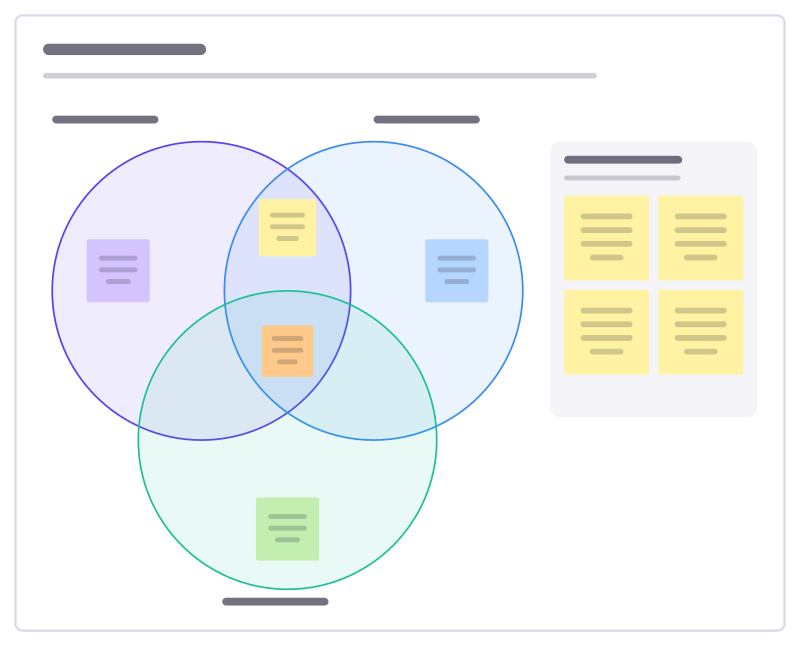
Venn diagram
Three overlapping circles to compare ideas and find what they share.
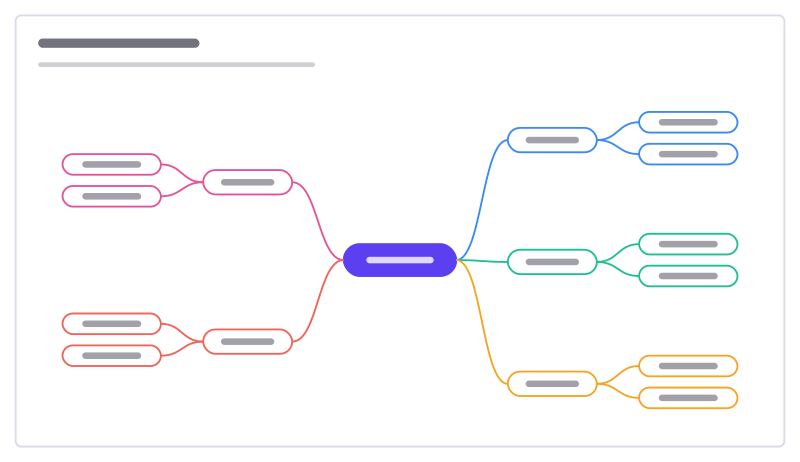
Mind map starter
A central topic with branches and sub-ideas, ready to grow in both directions.
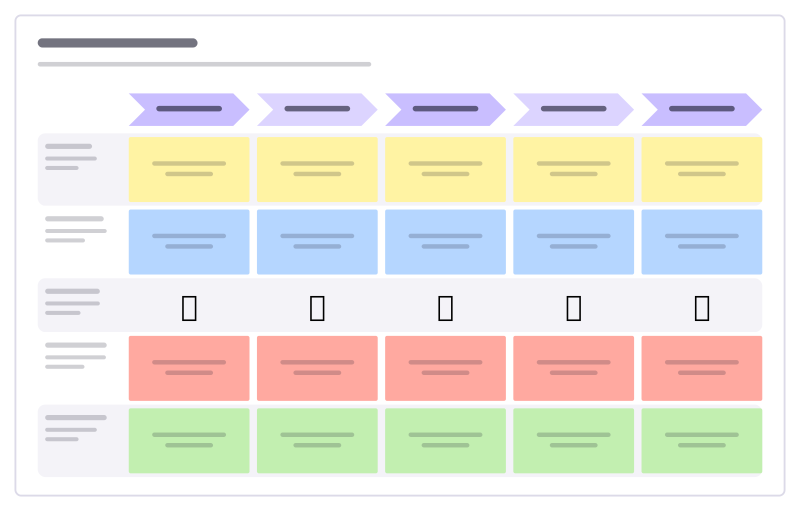
Customer journey
Stages across, lanes for doing, thinking, feeling, pain points and opportunities.
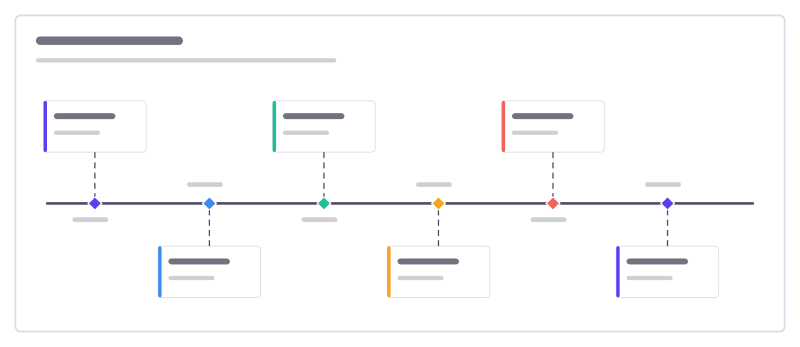
Project timeline
Six milestones along a time line, with what happens at each and who is involved.
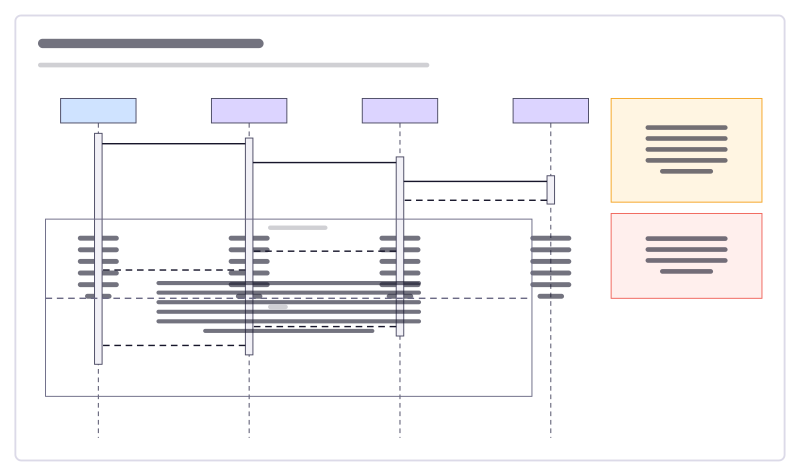
Sequence diagram
A sign-in flow as UML lifelines, activation bars, calls, replies and an alt fragment.
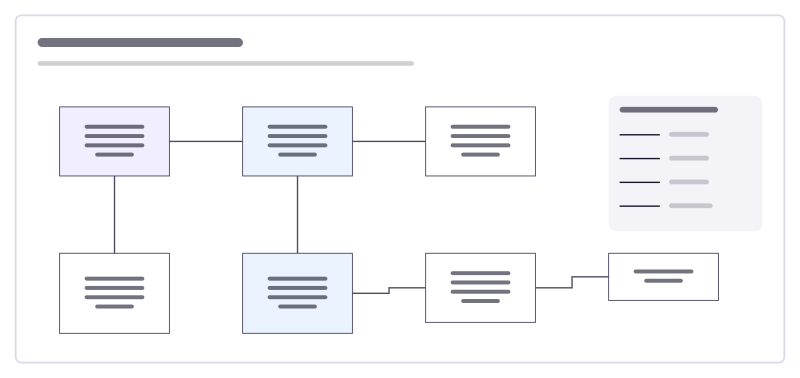
Data model (ERD)
An online shop’s tables and how they relate, drawn with crow’s-foot ends.
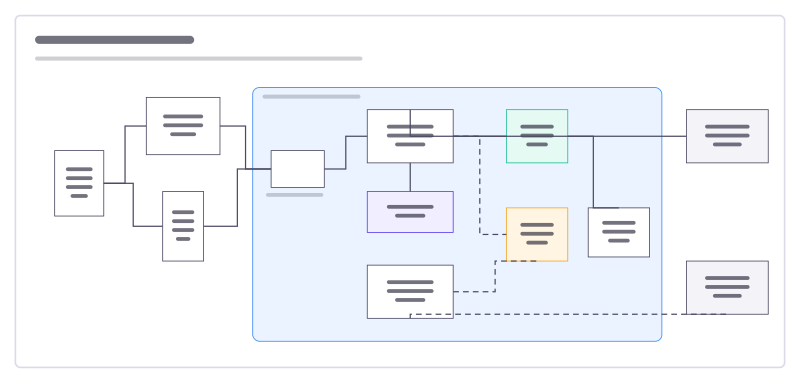
System architecture
Users, apps, services, data stores and outside providers, with what talks to what.
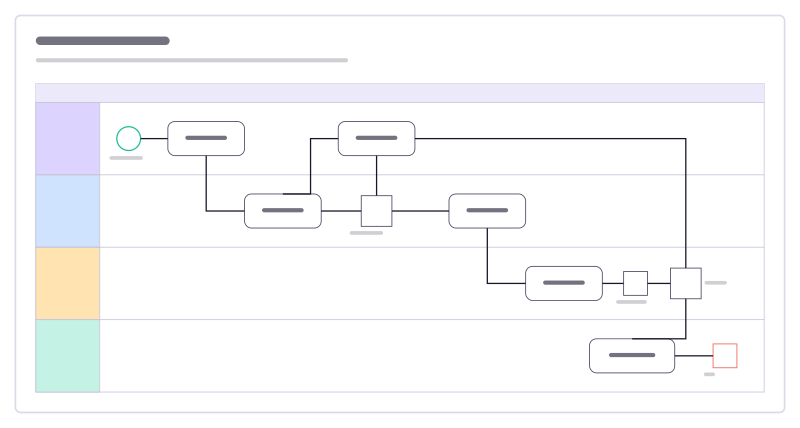
CI/CD pipeline
From pull request to production across four lanes, with BPMN events, tasks and gateways.
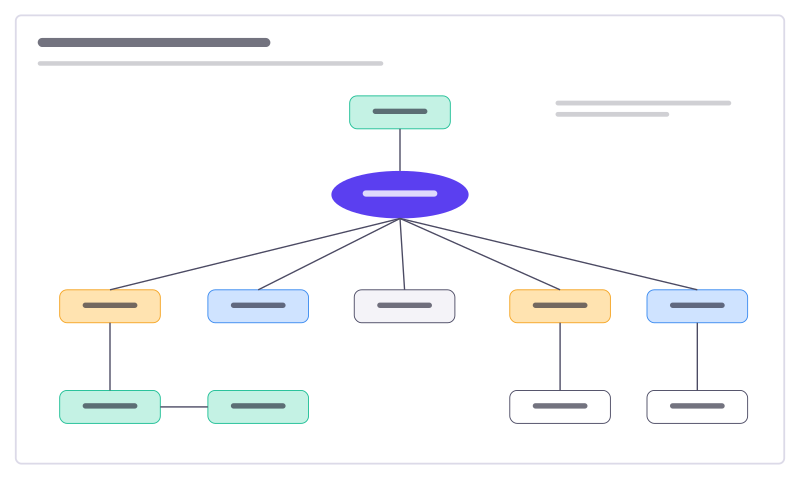
Concept map
Ideas linked by labelled arrows that say how they relate, around photosynthesis.
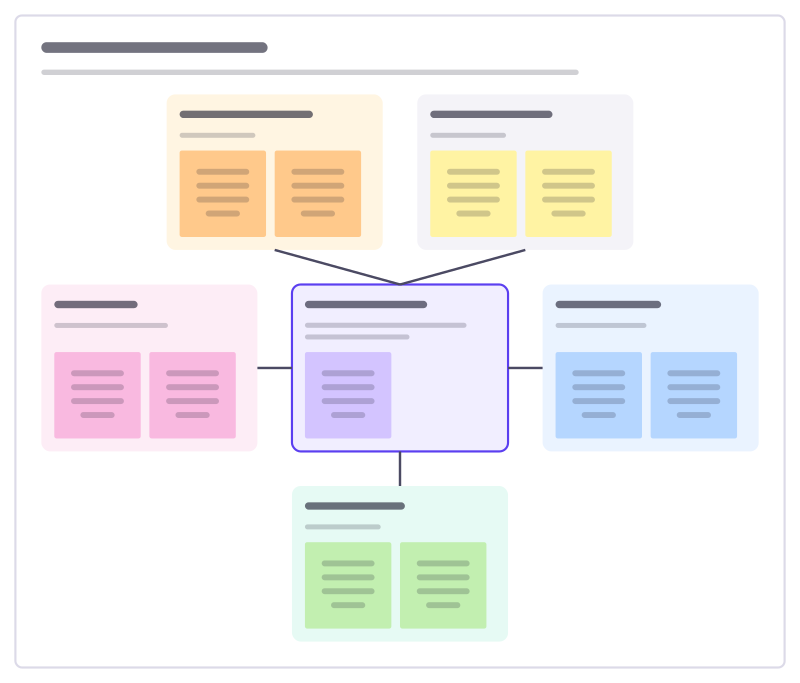
System context sketch
The big picture of one system: who uses it, which other systems it talks to, and what flows between them.
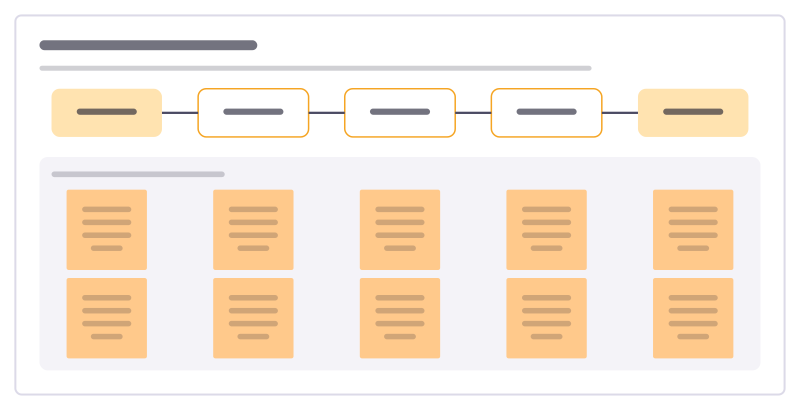
Domain events workshop
Map a business process as the events that happen in it, with the commands, people and rules around each one.
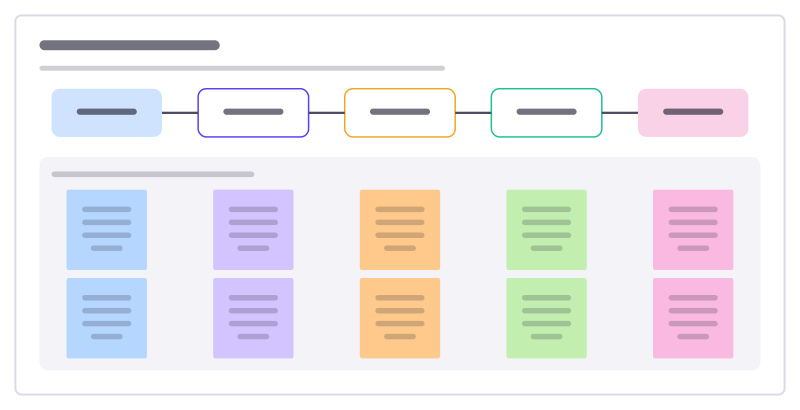
Data pipeline map
Follow data from where it comes from to where it’s used: each stage, its owner, the checks and how fresh it is.
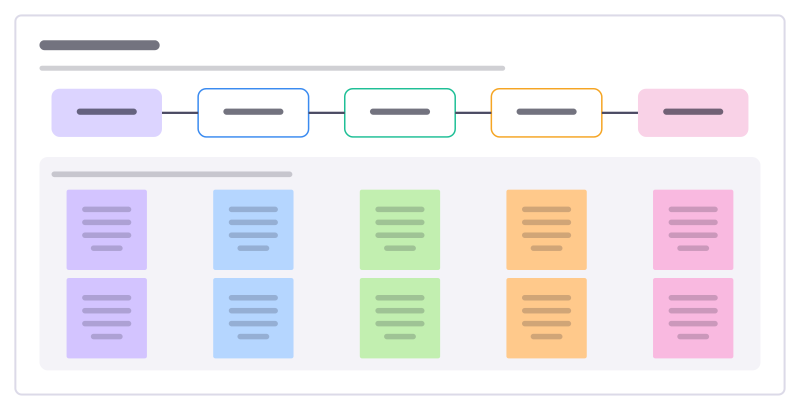
User flow
The screens and steps a person goes through to finish one task, with what each step must achieve and where it can go wrong.
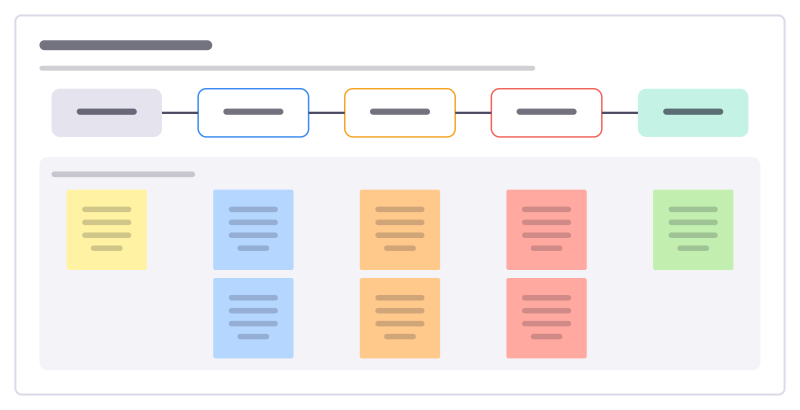
Value stream map
Follow one request through every step to delivery, with work time and wait time at each, to see where time really goes.
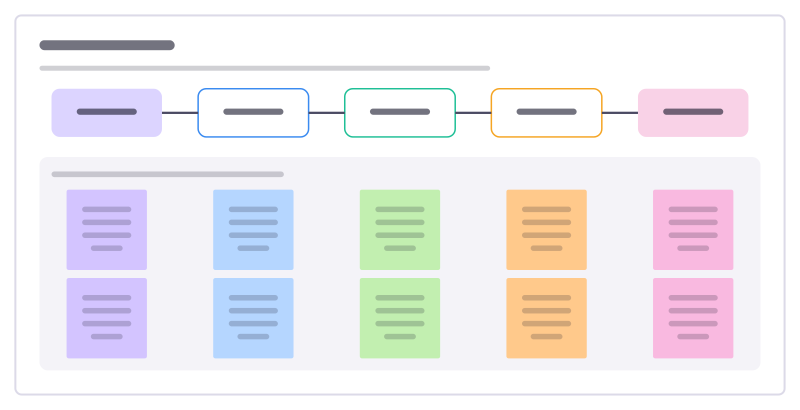
Process map
Lay out how a piece of work really flows today, step by step, with who does it, the tools involved and where time is lost.
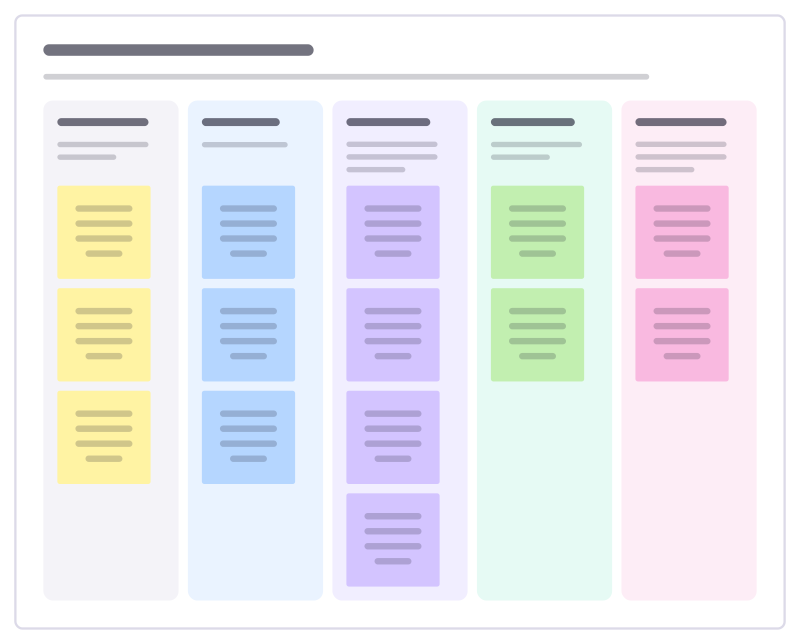
Supplier-to-customer map
One process on a page: who supplies what goes in, the few main steps, what comes out and who receives it.
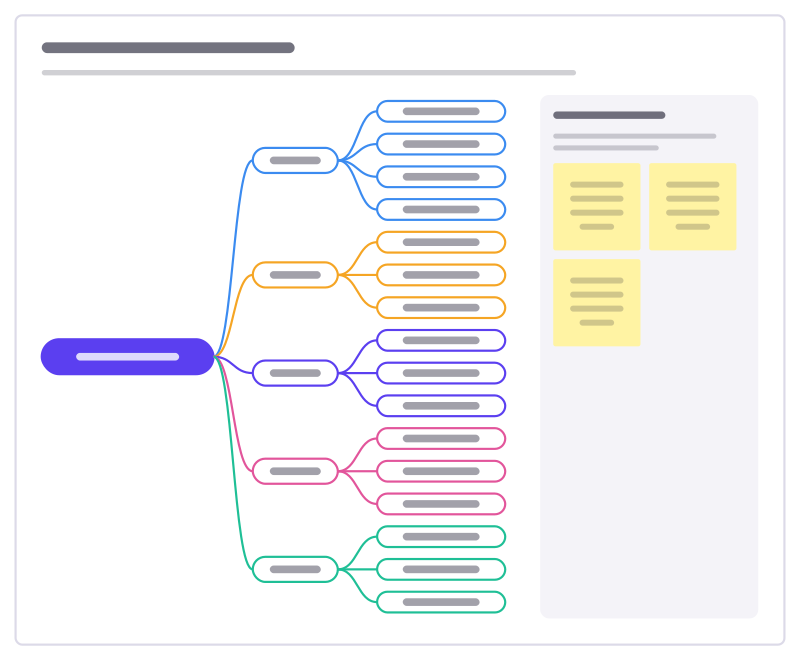
Work breakdown structure
Break a project’s deliverable into the pieces of work it takes, level by level, until each piece can be estimated and owned.
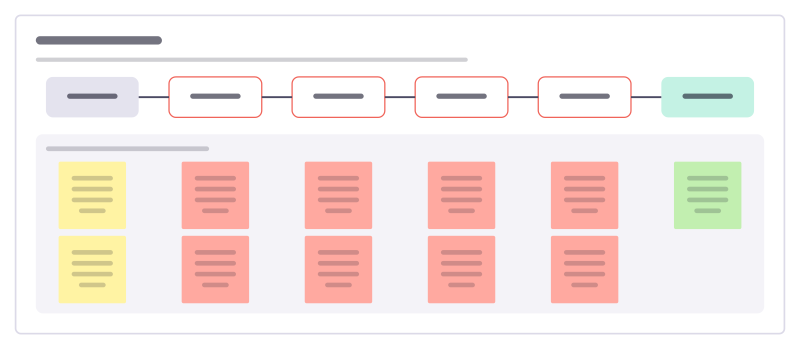
Critical path
Line up the chain of tasks that sets the earliest finish date, with how long each takes, so you know where a delay moves the whole project.
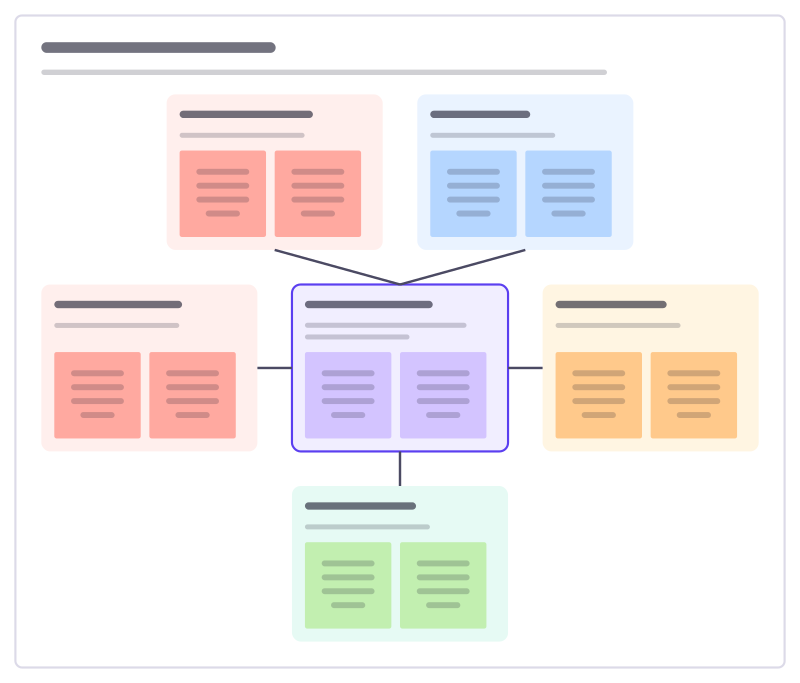
Dependency failure map
Put a service in the middle and ask, for each thing it depends on, what users see when it fails and how you would cope.
Bring your team and your agents to one board
Free to use, open source, and yours to host. No credit card, no seat count.